SPC in Plating 101: How Statistical Process Control Drives Quality & Cuts Costs | Lab Wizard
Table of Contents
SPC in Plating 101: How Statistical Process Control Drives Quality & Cuts Costs
Ever wondered how the best plating shops deliver flawless finishes batch after batch?
Statistical Process Control (SPC) is the answer. This article will:
- Explain SPC fundamentals and why it’s essential for surface finishing.
- Walk through key charts, from control charts with Western Electric flags to CpK histograms and Pareto analyses.
- Show how integrated tools can turn data into early warnings, material savings, and audit-ready reports.
- Point you to next steps, so you can see for yourself how it works with your data.
Why SPC Matters in Surface Finishing
Surface finishing juggles dozens of variables such as bath chemistry, current density, temperature, surface finish parameters, and many more. Small shifts often cause major defects: flaking, pitting, burning, or off shade finishes are just a few. SPC gives you a built-in early warning system to automatically:
- Detect real deviations vs. normal variation so you adjust only when it truly matters.
- Spot out-of-control signals (±3σ/Western Electric rule triggers) before scrap parts are produced.
- Optimize material usage by plating to spec and only refreshing chemistry when necessary, reducing precious metal waste.
- Generate audit ready reports that prove your process stays within control limits.
Key SPC Charts & How They Work
Below are the core SPC tools built into Lab Wizard.
Concentration Trending Chart
Tracks bath chemistry or any other recorded metric, over time to catch gradual drifts before they impact quality.

Control Chart with Western Electric Flags
This chart plots each point versus control limits and flags rule breaches automatically (seven point runs, two out of three beyond ±2 σ, etc.). It also displays the process mean and control limits at ±1 σ, ±2 σ, and ±3 σ.

Moving Range Chart
Plots the range between consecutive data points to reveal sudden jumps or irregular sampling.

Process Capability (CpK) Chart
Combines a histogram with an overlaid bell curve, shows your specification limits, and displays capability indices (Cp and Cpk) for an at a glance view of process performance.

Pareto Chart of Out-of-Spec Causes
Automatically generated pareto charts, useful in ranking the most common defect causes so your team tackles the biggest issues first.

Understanding Process Capability
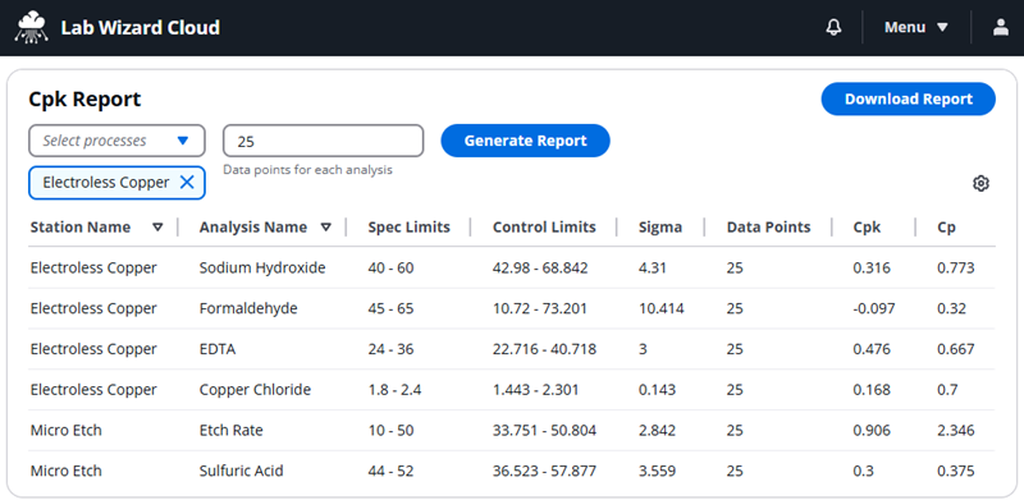
Quickly create a Cpk report in Lab Wizard for direct visibility into your process capability.

CpK Values and Process Capability
Use this table as a quick rule of thumb when tuning process parameters, understand how CpK maps to defect rates and required action.
| CpK Range | Process Capability | Defect Rate (PPM) | Action Required |
|---|---|---|---|
| CpK ≥ 2.0 | Excellent | < 0.002 | Monitor and maintain |
| 1.67 ≤ CpK < 2.0 | Very Good | 0.6 | Continue current process |
| 1.33 ≤ CpK < 1.67 | Good | 63 | Minor improvements |
| 1.0 ≤ CpK < 1.33 | Marginal | 2,700 | Process improvement needed |
| CpK < 1.0 | Poor | > 2,700 | Immediate action required |
How Customers Leverage Integrated SPC
Our customers tell us that having integrated SPC charts and automated alerts in Lab Wizard has:
- Reduced rework by up to 30%, by automatically catching process drift early.
- Saved thousands in precious metals, by fine tuning process capability.
- Streamlined audits, with simple reports proving every processes conditions over time.
These outcomes reflect how leading shops integrate SPC to drive measurable gains using Lab Wizard.
Next Steps
Ready to set up SPC for your processes?
- Request Your Free Trial: Log in and start recording data to see our platform in action.
- Set Up Auto Scheduling: Set up process schedules and let Lab Wizard notify your team exactly when and how to record the data.
- Turn on SPC Rules for Automated Alerts: Receive automatic in-platform and/or email alerts immeditately when out of control conditions are triggered.
